Friday, June 3, 2011

Jobs, jobs, jobs. Fri Jun 3

The US jobs report comes out tonight and you could argue that the market has already reacted to a bad figure. Last night, the US indices were looking to sell off but rallied on EU moves regarding Greek debt (according to FnArena's morning summary). The DJIA and S&P500 both finished a little lower but the Nasdaq gained. European indices were playing catch up from the previous night and sold off 1 to 2%.

The Asx 200 spent most of the first hour struggling to hold a small gain, it's up 4 at 11.06. I have a new long position in biotech company, Starpharma. It's in a strong uptrend which is pretty unusual for current market conditions. I'm buying a break of yesterday's high after a brief, 3 wave pullback. Long at 153.5 with a stop at around 147. It's illiquid so the position is not large.

chart

12.33 Whoops! There she goes...the Asx 200 has slipped below the recent swing by a point.

chart

The low was 4581.8 versus 4582.7 but we could extend that easily enough. The index is down 18 points and most of my stocks are lower by a commensurate amount. I'm just sitting tight.

2.09 There's been a choppy rally of about 10 points which is not significant in itself, but it raises the possibility of a double bottom. It is a new low by 0.9 points but essentially a (potential) double bottom. Meanwhile, the Nikkei and the HSI are down a touch but mainland Chinese markets are strong as is the Indian market.

Unsurprisingly, I'm hoping for a US index bounce tonight because I'm primarily looking for bullish trades with the market here.

2.19 I doubled up on the IPL June 400 calls. With the stock back down at 368, they're a fair way out of the money but at 2 cents I thought it was ok. There are 3 weeks to go and a higher low could still see a push through 400.

chart

3.52 Caution prevails and the index has made another marginal day's low at 4580. A similar story elsewhere too.

4.14 The Asx 200 finished down 17 at 4583.

Thursday, June 2, 2011

Just like elastic. Thu Jun 2

That rubber band was getting stretched and the market has snapped back 91 points with just over half an hour of trading gone. US indices had no late recovery and suffered the worst loss for some time with falls over 2% across the board.

There are few safe havens with banks selling off hard and resources hit by a slowing US jobs market and weaker PMI numbers around the world. I'm out of IPL stock at 376 (v 384,385) as it has a second leg down. I have the June 400 calls which have slipped from 6 to 2.5 but that's small beer.

chart

Otherwise, FMG is down 16 at 653 but no action is needed there while LNC has fallen another 5 to 309. I started buying a few OST towards the close and that stock is off 5 to 184. It's a small position and I'm using a wide stop so no action there.

The US markets have been in a trend channel down; the indices had stretched the top band and now are close to the bottom of the channel. Here's the S&P 500 chart.

chart

The downtrend in Australia has been much steeper, reflective of tight monetary policy, but the recent behaviour is much the same. I'm hopeful of a higher low this time but unlike the last time, I'm going to wait for strength before buying anything new.

chart

12.02 Just heading out for an appointment. The Asx 200 is bobbing around the opening levels. The major Asian markets are down 1.3, 1.5% which is a little better than us and Shanghai is only down around 0.6%. While there are dark clouds on the horizon, one area of optimism is in the Chinese tightening cycle which might be drawing to a close. Not a factor today though.

2.04 Not a lot of change but a bit lower, down 96, and a tick above the early low. Asian markets have followed us down further so no encouragement. I've taken a hit on FMG June 650 calls which are down to 16.5 from 31 but other than that, it's fairly mild. Just a bit boring, to be frank. Now that I'm not trying to pick intraday lows, there's precious little to do on a day like this. Not making it any worse is a reasonable outcome.

4.11 It's Armageddon all over again. The index fell 115 points and closed lower by 107 at 4600.4. Last time it did this, all of two weeks ago, I tried to buy a potential higher low. This time I'm just going to wait. Here's the chart.

chart

Wednesday, June 1, 2011

Stand down Twiggy. Wed Jun 1

A strong night in terms of index movement but no fillip for us because it was fully anticipated. Base metals improved slightly and oil was up a couple of percent. With 40 minutes gone, the index has lost an early 5 point lift to be off 8.

I'm out of LYC at 234 because there was no carry through buying at the open. LNC has slipped 8 to 320 so I'm glad I sold a handful yesterday afternoon. I hope it's a shallow pullback like we had on Friday and Monday.

chart

IPL is down 3 to 381, which is disappointing because US fertiliser stock, Potash, was up again and there's often a correlation. However, FMG is promising. The stock has traded as high as 661 which means the breakout looks on. Andrew "Twiggy" Forrest has stepped aside to be Chairman with the new CEO being the well respected Nev Power. It clears some of the uncertainty if Forrest is required by the courts to step down from day to day involvement in the company.

chart

11.25 I'm out of KAR at 657 (v 652). Given that the index is stalling at the top of the trend channel, I only want to be in the 3 positions which I'm confident about. Here's the XJO chart.

chart

11.32 Q1 GDP is in with a flood led drop of 1.2% which is better than expectations and the index has ticked up a few points. Chinese PMI figures are due out later today.

12.38 Chinese PMI for May is 51.6 v 51.8 so it continues the very gradual slowing of growth. It hasn't scared the horses; the market here and indices in China are consolidating after yesterday's gains. The Asx 200 is 3 points lower.

2.35 Back to the office to find the index up 12 but my stocks little changed. LNC has been sitting between 315 and 317 for a couple of hours and I've been tempted to buy some back but there's no real need yet. The 60 minute chart, below, has no obvious buy signal.

chart

FMG has just come out of suspension following an announcement that the company is bringing forward its 155m tonne a year expansion to 2013, a year earlier than previously planned. The stock has gapped up to 667. Here's the 60 minute chart for FMG with the potential for some more acceleration, I think.

chart

4.05 It looks like the index will match lower. The market has been slipping from the peak at 4725 to 4714, up 6, and now the SPI is selling off.

FMG had a surge and reached 677. I had some intraday longs which I sold at 670 (v 659) but I'm leaving the calls as I'm hoping that there are bigger fish to fry with those.

I'm starting to buy a couple of OST but I'm not sure if that's going to pan out so I'm going slowly and will either cut quickly or write about the trade tomorrow...most likely.

4.14 Not too bad, the index down 1 and FMG held quite well to finish up 17 at 669. LNC couldn't recover and slid further to close down 14 at 314.

Tuesday, May 31, 2011

One for the road? Tue May 31

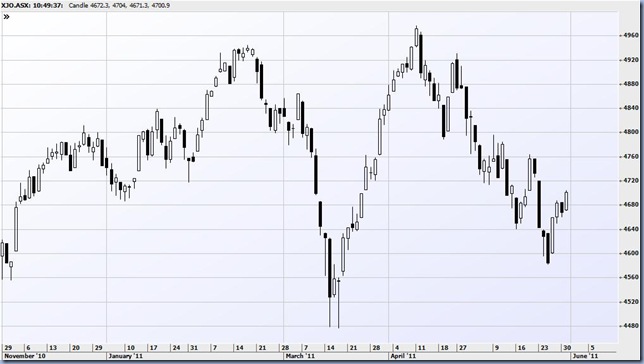
With the UK and the US markets closed for holidays, the early 35 point rise in the market is a surprise. The overnight SPI futures contract was indicating about a 14 point rise which was a reasonable guess, essentially a reversal of yesterday's drop. Maybe it's some end of month window dressing but I'm happy to see the rally. If the Asx 200 is going to halt at the top of the trend channel then this might be as good as it gets so I'm looking to sell out of anything that looks unconvincing.
chart

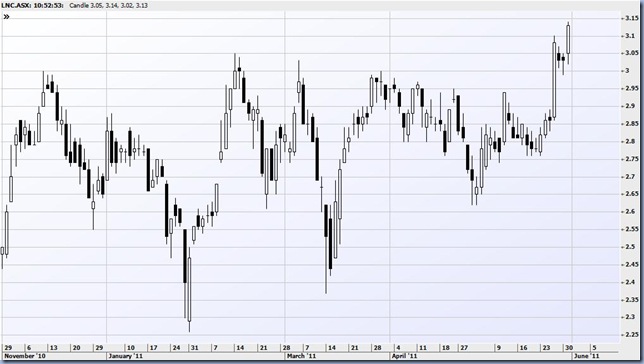
First the bad news, I stuffed up my exit of the last few PDN. Selling on the open at 312 after twice trying and failing to sell at 322 on intraday retracements yesterday. Stock is 318 now. The good news is that 2 of my 3 main longs are doing well. The best is LNC which is continuing on after a few days consolidation. Up 9 at 312.
chart

I was looking for coal companies with bullish charts yesterday as coal demand seems set to keep rising. I couldn't find anything and although LNC is, strictly speaking, a clean energy company, it's a nice coal play in the short term as it looks to sell its coal assets.

FMG is also firming, up 7 to 647, although the stock needs to hit around 660 before the breakout looks compelling.

chart

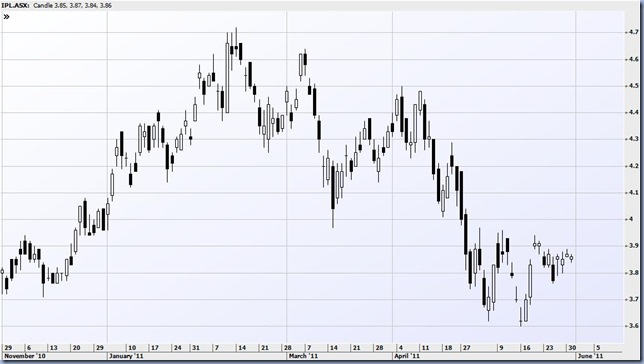
The last of my larger long positions is in IPL and that's down 1 at 386 but still charting ok. My stop is below the 376 swing low and the obvious risk is that there's another leg down, although my view is that it would make a higher low.
chart

I have a small long position in KAR. This has a similar chart to IPL (above) but is slightly more bullish having made a higher low in mid May. I sold a couple out at 655 (v 652) this morning.

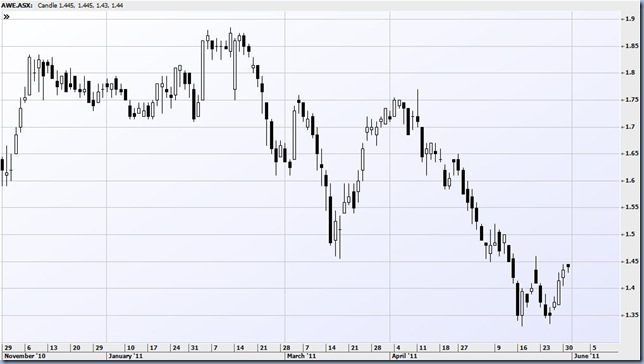
I'm out of the AWE trade at 144 as it's stalling below resistance. This is a judgement call, the stock could still push on but with the overall market potentially stretched I want to stick to a few trades only.
chart

My last position is in LYC and I intend to sell this today as it goes into the MSCI index. The stock might have been expected to run but it seems as if there are investors who are happy to sell into the index buying and the stock is up just 1 at 227. There's a big decision looming regarding the Malaysian refinery which is still under construction and news reports suggest that approval is not a sure thing. It might be wise to steer clear of the stock for a while and keep an eye on ARU which would be a beneficiary of delays at LYC.

12.12 The market is up 44 and stretching the downtrend channel. I'm getting tentatively hopeful that the rally might have more legs. Figures released at 11.30 showed Q1 exports lower, due to the floods presumably, and a generally softening picture vis a vis the consumer. No surprise again as the two speed economy is affecting most people.

1.41 LYC has begun to move as the weight of buying starts to tell. I bought some extras at 227 and they're in front with the stock at 230. I suspect I can afford to hold some of my position overnight (whether I want to will depend on how it closes) because there'll be more re-balancing activity tomorrow and I think the environmental approval process still has a week or two to go. Around the 230 level is obviously quite strong resistance; there were peaks in early January and early March and now the stock is once again bumping against this level. If there's a late pop today, there could be some technical buying and maybe some short covering.

chart

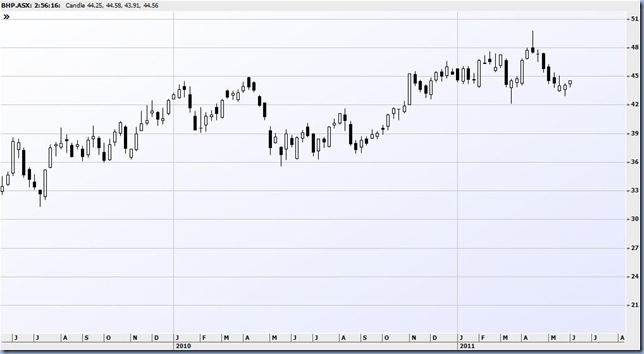
2.47 The weekly chart of BHP has a buy signal, and they're often quite reliable on the weekly charts. The Asx 200 chart isn't quite there, held back by the banks.
chart

I've bought some IPL June 400 calls at 6 cents each because if the market is able to make a sustainable recovery, it won't be much of a stretch for the stock to get to 420, 430. The chart is higher up the page.

4.03  I sold out the extra LYC at 233 average. The market overall is near the highs, up 46 points and is reflective of strength in the region with the HSI and the Nikkei both up strongly.

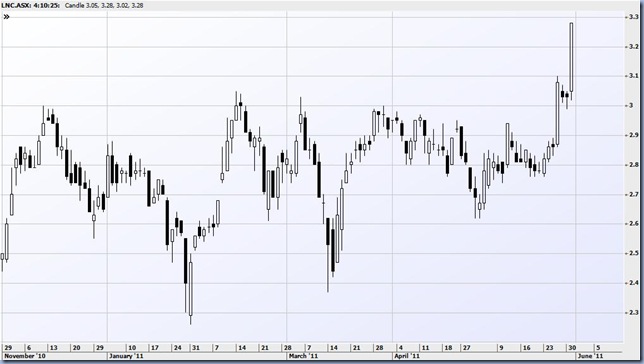
4.12 The Asx 200 closed 41 points higher at 4708. I sold out a few more LYC at 237 and have 10k left. I also sold 5k of LNC at 328, leaving a balance of 25k. The stock looks red hot but I wanted to take something off the table. Here's the daily. In Elliott wave terms, it looks like the 3rd of the 3rd. It closed at 328, up 25.
chart

The month is over and it's been smack on budget thanks to two good days late in the month. A stock that's in a genuine bull market like LNC can really make all the difference. Mostly I'm chopping around in stocks that are going nowhere, making a few dollars here and there.

I've been missing one of the hot sectors in the market at the moment, which is biotech, but I'm starting to track a few stocks and might rotate a couple into my watchlist soon.

Monday, May 30, 2011

Wishy washy. Mon May 30

A mildly positive lead has meant little because it was pre-holiday trading and today is seeing a pullback after the good recovery on Thursday and Friday. Down 15 after an hour.

I've sold half of the AWE position at 141.5 (v 137) as it's an a-b-c bounce and remains in a downtrend. The stock looked ready to fade away but is perking up slightly. The drilling program is underway but is due to take 37 days so it's not a high conviction trade for me.

chart

PDN is not dissimilar to the AWE chart and it has sold off after hitting intraday resistance at 328 following small rises overnight in the Toronto listed shares. I've only got a small position but missed my chance to stop out around 325, 326 because I wanted to give it a chance to break 328. Now it's at 319 so I'm thinking of tipping the balance out on a retracement.

chart

I'm writing about these two unexciting trades because they're the sort of bread and butter trades that I've found to be worth taking while you're waiting for the great ones to come along. Usually they pan out to be simple c waves that offer a few cents profit if the entry and exits are right. Obviously, it's better to go with the primary trend and ignore these but I tend to take them when I think the trend might have turned. In those cases, the moves can be quite hard and fast as you benefit from the element of surprise...short squeezes, unexpected good news etc.

11.44 The market is falling slowly, down 22, as the selling/shorting of the major banks resumes. ANZ is the best performer with a fall of 1%. Resources are largely unscathed but I guess the general weakness in the futures contract must derive some arbitrage selling.

I still have 15k of LYC which are back to my entry level of 222. This is slightly surprising but unlike AWE and PDN, the stock is not in a major downtrend and I've ignored the potential tight stop at 225 (break of Friday's low) in favour of the last swing low at 213. One of the reasons for this is that the stock is to be added to MSCI global standard indices as of the close of business tomorrow.

chart

1.51 A slight improvement had us close to square but it's back down 14 now. I'm not doing any new trades today because on recent performance, the bounce might be near the end. I'm long 5 or 6 stocks and plan to be reasonably quick to cut on renewed weakness.

chart

2.49 The FMG June 650 calls are under some selling pressure so they're down to 13.5 despite the stock being unchanged. I have 500 of them (or 50 in the old money), roughly a layout of $7500 for the upside on 50,000 FMG above 650. If the stock breaks lower, I should be able to short some and get a bit back on the downside, but for the moment I think the chart shows some promise.

4.10 We've got another day of this dreary trading coming up tomorrow with the US public off work for Memorial day. It's a bit of a strange habit really since we no longer react to US movements so predictably now that China is such a big influence. But it is what it is and the final result is a loss of 17 points to 4667.