Tuesday, March 31, 2009

End of quarter. Tue Mar 31

Today is one of those days when we're ignoring the weakness in European and American markets last night and running our own race having rallied from a weak open to be down 6 points at 11.30am.
My positions are slightly against me and unfortunately I was stopped out in gmg at 31.5 when it's now 34 and unchanged. I still like the stock but I was pre-empting a move. The next stop after 31.5 was 25.5 which was too far away so I took the cautious approach. I was also stopped out of shl as another pre-emptive trade failed to go my way. I had only put on a small position here and cut at 1137 as the stock pushed through my entry signal of 1120 and headed towards the 1140s which was my original cut level. I decided to cut early because I was discussing the stock last night and it occurred to me that if the market was going to give back some of its recent gains then active traders might switch back into the safe havens. When I looked at the health care sector I could see that Cochlear (coh) had made a reversal low and was rallying while csl was also bouncing off lows.
That led me to buy some csl at 3300, prematurely I think. The break on the weekly chart is 3320 and I got carried away with the surprise rally in the market. My stop is at 3235 and I'm crossing my fingers that I don't have to pay for my impetuosity later today.
The daily chart shows the 3rd consecutive day in a tight range after a quick run up from 2994. Because this latest consolidation has overlapped a previous one from about 10-15 days ago I suspect that there is more of a rally to come; which doesn't mean we couldn't fall a dollar or so first.Lgl and ncm are two other safe haven stocks that I shorted yesterday that have rallied against me this morning. Lgl is just up 1 to 324 but ncm is up 2% or 71 at 3302. Because I took these on a weekly signal I'm slightly more comfortable to hold with wider stops but I'm now doubtful about these trades. Fmg and tah have done pretty well. Fmg rallied after early weakness to be up 4 at 253. I've just reduced my position slightly but I'm still hopeful of new highs soon. Tah is up 9 at 654 after holding support at 640. Lnc also fell to support at 190 but is back now at 205.

I put on two new short positions this morning. One was in Brambles, bxb, a maker of pallets. This is pretty straightforward and I've put on a slightly bigger position than usual. Here's the weekly showing that the rally didn't overlap resistance at about 650.

The daily is very weak. There was a sharp fall 4 days back with virtually no retracement in the next 3 days and today is down 8% now. The 30 minute is basically the same as the chart above. I sold most at 492 and some more at 484. The stock is having a small rally now to 480 from a low of 474. I think there's a pretty good chance we'll test the recent lows of 408. Although I base my trading on chart patterns I do follow market news and it's interesting that there is concern about Brambles' business model. They distribute wooden pallets and are starting to lose contracts to competitors working with plastic ones. So although valuations average around 600 there is a reason for the stock to be sold off heavily as those numbers would be based on assumptions of no threat to their model.

12.30 Bxb is now up to 486...and on to my other short. It is Incitec Pivot, ipl, who are in the business of fertilisers and industrial chemicals. It's not such a clear cut chart on the weekly and because of the scale and the size of chart I can fit on these pages I'll stick to the daily. On the weekly, it had a lacklustre 3 wave rally but it did slightly overlap a previous low at 220. I'm in two minds as to whether we'll see new lows but the daily break is clear and I think there's enough room to make money on a higher low. Here's the daily chart showing a new low today formed when the stock fell below 208. I shorted it at 206 and it's now 204 having been to 203.
12.45 One of the stocks I've been watching closely is Fairfax, fxj, who are a media group. The weekly chart shows a reversal low which has consolidated near the top of the range.
The daily shows how tight that consolidation has been. A trade above 108 would trigger a weekly buy signal. However, a closer look shows that in the last 5 days the stock has stopped at 103, 3 times. I'd buy on trades above 103 as I think the stock could quickly move to 108 and might continue through.

1pm I decided just to cut lgl and ncm as they look too good on the intraday charts and the dailies have reversed sharply. Lgl bought at 325 having shorted at 318 and ncm out at 3331 having sold at 3215.

2.45 It's been a bit of a mess for me today. The market is up now but my shorts have been going a bit better than my longs. I cut csl at 3280 - I figure I'll wait until I get a proper signal. Lgl has pushed on further to 328 but ncm has failed and reversed back down. I've been thinking about reinstating my short but have decided against it. I have bought some fxj at 103.5 on the break. My positions are long cnm, fmg, fxj, lnc and tah and short bxb and ipl. At least I'm comfortable with all my positions now after the transition of the last couple of days.

3.56 I went through the top 50 a little while back and there's nothing new. Axa broke down earlier but I don't want to chase it, I'm hoping for an opportunity on the daily through a rally then resumption of the fall. Also, being the end of the quarter the action today is not going to be totally reliable.

4.10 In the end the match out was fairly unremarkable. Ipl closed near its highs but bxb slipped back towards its lows for a 480 close.

Monday, March 30, 2009

A pause for reflection. Mon Mar 30

It's midday and the xjo, top 200 index, is down 45 points or 1.2%, recovering somewhat from a low of down 58. This is in line with moves in the US on Friday.
I haven't done anything yet today and the question is whether to get out of any long positions. I feel that they're all ok on a weekly basis but that a few of them have the potential to pull back sharply in the shorter term. This also raises the question of how consistent I should be with time frames. For example, if I've put on a position due to a breakout on a weekly chart should I only cut my position on the basis of a weekly stop? My answer is sometimes yes, but more often no. I'm using weekly signals as my primary decision making tool but I still prefer to get in ahead of any potential breaks. Sometimes, that's from a simple weekly pivot but I'm occasionally using a confirmed break on a daily or 30/60 minute chart to get in ahead of that. In those cases, I'll use tighter stops but my goal is to be able to ride the trade for longer. There are other situations where I'll decide to cut a position such as: at a profit target, on a fast gap, where there is a complete looking pattern or when it looks like there's a retracement in action and it could be quite deep. I want to leave room for intuition and for the sense of flowing with the market action because often I don't work out till later why a stock looks good; but I also want to examine these trades and work out when it's just wishful thinking.
One thing that I do often find problematic is to have too many positions and I am planning to cut a few of those outside the top 50 and my little list of favourites. At the moment these are aoe, ctx, and mgr. It may not be today however, I want to act at the right time.
I've been through the top 50 this morning and the stocks that I was thinking would develop as shorts have done so: these are bhp, lgl and ncm. I like ncm best of all of these. In addition I've got bxb, ipl and shl as potential shorts while fxj is the only long.

12.45 I've put on a few short positions now in lgl, ncm and shl and I'm trying to sell out the balance of my mgr position at 94.
Lgl first, the weekly chart shows a 5 wave advance with the pullback in late February overlapping the 3rd wave high in late December. There was a recent attempt to make new highs last week which faltered and now we have a break of last weeks low of 318. A confirmed trend change would require a move below 282 but I would rather go early on less evidence as I'm confident in my reading of the situation.
The daily chart shows a clear sell signal as the stock fell from 343 to 318, had a small rally and has now been as low as 316. My concern is that the pivot at 308 from 11 bars back might act as support and the stock rally back towards the highs. I'd therefore consider having a pretty tight stop early on, perhaps 330 which is just above Friday's high.
Next is ncm which has a very similar 5 wave advance as lgl but with a more complex 4th wave correction. It also seems to have failed on an attempt at new highs and has marginally breached last week's low of 3211 this morning.
I prefer this chart to lgl because the daily chart has clearly started to overlap giving me greater confidence that the retracement rally is over.

My short term problem is that the 30 minute chart is very extended with a bullish reversal forming so I've bought back my short and gone slightly long with the intention of reinstating the short later today. I think it could rally back to a recent trading range around 3270.

While I am looking for a change of trend in lgl and ncm, shl is more straightforward and I'm being more agressive here. The weekly chart shows a 3 week reversal rally which is well short of the previous range suggesting that the downtrend is still in place.
Skipping to a 60 minute chart (a daily break would be triggered if the stock traded through to 1080) there is a second time break of 1120 which could have enough momentum to trigger the daily (and at the same level, weekly) break. Because this is quite pre-emptive I haven't put on a full position and would cut if the stock were to rally much above 1140. 1.25 Decided to sell out of aoe as it continues to look a bit weak and I want to stick to the top 50 mostly. Sold at 276 vs entry price of 275 for a cost covering trade. Sold ctx at 979, looks pretty good on a weekly but soft short term; entry was 910. Sold last of mgr at 93.5 with a buy price of 85.5.

1.38 The rally in ncm didn't go far so reinstated my short position at 3215.

2.15 Getting a bit trigger happy and sold out of the balance of my tls position at 324. Because it was a straight reversal trade I was targetting 330. It got to 328 on Friday and today is an inside day. I still think it can get to 330 but my scenario is for the stock to fall to 318-320 first, so if that does happen and the stock resumes I might try to reinstate a small position. Entry level was 310. And out of gpt at 43.5 vs entry of 39.5 as the daily chart falters and the weekly break hasn't happened.

3.30 The market has had another leg down and is now lower by 2%. My positions are: long - cnm, fmg, gmg, lnc and tah and short - lgl, ncm, shl. My longs, with the exception of cnm, have taken a bit of a hit but I want to stay in them. I'm close to a stop in gmg but the stock will probably hold today, while tah has pulled back to the breakout level. Fmg and Lnc are having sharp retracements after good rallies but look incomplete. By incomplete, I mean that I expect a new high in the short term. Here's lnc as an example.

There was a fast break last Thursday taking lnc from 190 to 246 by Friday morning. Once a short term peak is formed you can expect a sizeable pullback yet typically you can also expect to see a new high in the short term even if it's quite marginal. Here's an example from the same stock, Link energy, earlier this month.

There was a breakout on the 9th from a tight range. The surge retraced for nearly 3 days although the price held pretty well and then popped up to a new high.

4.24 A pretty crummy end to the trading day as my longs went nowhere and my shorts pushed up a bit. It may not be the end of the short term rally but it was a big warning day that we might be getting close so I'm happy to have taken a more neutral market position. Now I have to hope that my stock selections are correct.

Friday, March 27, 2009

Sitting on my hands. Fri Mar 27

The market is up yet again, another 1% at 11.19 am. Of my current positions, aoe is down 4, cnm is unchanged and ctx is up in line with the market. The rest are outperforming nicely. Highlights are lnc which is up 21 or 10%, fmg up 5%, gpt up 10% and mgr up 13% so I'm happy with that. Admittedly these are largely low priced stocks so they are prone to move a lot in percentage terms. The US lead was strong again on the back of a reasonable bond auction and a less alarming crunch in GDP than feared with resources being a stand out.
I sold a small amount of fmg and lnc on the opening gaps, but mostly it's a matter of sitting on my existing positions as they're not showing any sign of stopping yet. I have added a new position which is a stock I've had as a potential buy for a couple of weeks. Tabcorp or tah, has finally pushed out of its trading range. I bought, rather tentatively, at 646 as it was already up 18 cents and I was nervous that this was merely a stretching of the trading range but after a pause the run has continued and the stock is now 655. Here's a 60 minute chart for the last month showing how tight the range has been.
The daily follows....
....and the weekly gives some idea of where a rally might find initial resistance. I'd assume around 700.
11.57 The only potential sells - for next week - that I can find are lgl and ncm as they could have made a lower weekly retracement high after a 5 wave rally. Bhp is an outside chance as it has been making higher highs but also lower lows on the weekly while it's still below a handy resistance level of 3600. On the plus side, the property trusts are showing signs of the rally confirming weekly buy signals. Mgr got as far as 99 which it needs to break while gpt has made a daily break today though it's still well below the recent weekly high at 54. Gmg is similar to gpt but much closer to a weekly break and with a little more strength today it can also make a daily signal. I'm watching it fairly closely and might buy on some short term strength. Here's the daily which gives the clearest picture.
I think that a breakout could take this stock to 60 fairly quickly.

1.20 I bought some gmg at 36, deciding that the break above 35 on the 600 minute chart was sufficient to get started because the other time frames and also gpt and mgr are supportive. I also sold a small amount of gpt at 45 and mgr at 97.5 to take a little profit and sold some tls at 324. The market is consolidating after a strong start, US overnight futures are a little weaker and the Friday afternoon of a strong week will often see some profit taking so I thought it wise to sell something.

3.16 I'm leaving early today but the index has given back much of the early rally with the top 200, xjo, up 16 points versus an early high of up 59 points. My positions have deteriorated but fortunately have held relatively well. I sold another handful of mgr at 94.5 and will sell a few more tls at 328 if it gets back to this earlier high. Aoe is the weak spot today but even that is sitting above support and is off its lows for the day.

Thursday, March 26, 2009

In the too hard basket. Thu Mar 26

For a change the Australian market is not trying to pick the overnight move and is simply up 16 points (at 11.10am) with most stocks moving independently, eg of the 4 major banks, 2 are little changed, one is up, one is down.
I've had one mess to clean up which is ilu, it closed on its lows - which could have been a clue for me to get out last night - and gapped 5% lower soon after the open. I sold at 401 versus an entry price of 449. I took a long time to decide to buy this stock and examining the trade in retrospect I realise that the chart was very much like fgl, my other recent dud trade.

In both cases (fgl last week and ilu this week) the signal was negated quickly and only appears as the thin range at the top of the candle. Common to both charts is that they are in trading ranges making lower swing highs after peaking in the last few months, which means that bullish breaks must be very convincing to be worth taking and/or right at the bottom of the range.

I ran through the top 50 earlier and decided to take a trade in fmg at 237. There is no weekly break yet, I would have to see 250 for that, but there is an excellent set up on the 30 or 60 minute chart and the other time frames are quite supportive.
The daily chart shows a slow retracement to 218 after a February run that went from 165.5 to 334. If the daily can get to 244 it will be the first bullish pivot since then.

I've had to expand the weekly chart to get the scale legible but the 2 recent run ups have found higher lows - potentially, at least. The simple nature of the swings, one wave and similar size, is usually a sign that there's more to come. In elliot wave terms, it's possible that the first swing is a wave 1 and the second swing is a wave (1) of 3, ie part of a bigger bullish pattern.Until I get a good confirmation this is simply theorising and my stop will be around 223 based on the 60 minute chart.

Running through my existing positions: aoe is running well now, up 11 to 291; cfx is down 4 to 170 but this seems like a pullback to the trend line and I'm still bullish; cnm is unchanged at 19; ctx is down 21 to 987 after a very strong few days and still looks fine; gpt is up 1 to 36.5 and may still run up; lnc has ground up to 190 and looks ok technically but there is a lot of volume on the offer for a small stock; mgr has bounced back to 89 but needs to accelerate soon otherwise I'm out and I've sold a few more at 89.5; lastly tls which has been toying with a correction is holding well at 314.

3.09 Just got back from a late lunch with some old friends. The big change has been lnc which went ballistic between 2.35 and 2.40 pm going from 193 to 206. It's now 213 and is clearly through resistance. I'd like to buy some more but will only do so if there's an opportunity on a pullback. Given that there was stock on the offer at every price point from 189 upwards I had assumed I would easily be able to get set in the high 190's on a confirmed breakout. Otherwise, fmg has been as high as 247, confirming the break on a daily basis and it's now 243. Tls is back up at recent highs of 318 and the pre-emptive trades in the property trusts, gpt and mgr are looking pretty good at 39.5 and 92 respectively.

3.56 Had a run through the top 50 before the market closes for the day. No new signals although some marginal buys like rio continue to push ahead. The market is up 1.1% today but with the exception of ilu which I cut early on, most of my stocks have outperformed. I bought a few more lnc at 214 as the short term chart kept powering and they're now 221.

4.10 I decided to sell out of cfx, for the reasons I mentioned yesterday, at 170. I sold a few fmg at 247 as I'd bought more earlier at 239, averaging 238, and I just wanted to cover costs. I did the same with a few lnc at 217 on the match. Otherwise, mgr slipped back to 86 and I thought about cutting this but as gpt and gmg rallied today I thought it might just be noise. The market closed up 1% which is a pretty strong day although US overnight futures are firm and we could have gone even further.

Wednesday, March 25, 2009

One day ahead. Wed Mar 25

The Australian market is playing its usual game of guessing tonights action in the US. So instead of being down on a weak overnight lead, which we anticipated yesterday by selling off all day from the open, the xjo top 200 index is up 28 points. Most of my positions are doing well, in particular aoe, ctx and mgr. The only downer is ilu which has slipped 16 to 431. Not close to a cut but you do like to see momentum when you buy and a quick reversal is never pleasant.

I've run through the top 50 and the top 100. I found 2 potential longs and 1 short in the top 50 and an additional 3 and 1 in the rest. I've already got 9 positions which is too many so I plan to ease out of the trades in stocks outside the top 50 in the short term. There will be exceptions, with a few other stocks taking my fancy.
One of those is lnc which I've been waiting to buy for a week or so. It had a tight 3 wave correction and then a first go at the recent highs only to pull back yesterday. It looks like it will try to rally again today and as the 30 minute chart is breaking out from a higher low I'm buying a small amount here at 187. If the stock can push on to the high 190s it will be a daily and a weekly breakout so I feel justified in using this time frame. Here's the daily.

I've just sold out half of my position in cfx at 173 (entry at 167.5 yesterday); not because of a sell signal, although the intraday chart has paused, but more because I'm feeling uncomfortable with the number of positions I have (especially in stocks like cfx that I'm unfamiliar with) and also to take a little profit here and there.

3.00 The market has traded in a fairly tight range since around 11am. It pushed up a bit towards 2.30 and is slipping again now. I've only done a couple of things today, buying a few lnc at 187.5 average and selling some cfx. I was thinking about selling some mgr earlier as it spiked up and now I'm disappointed I didn't as the stock while still up on the day, retraced quite a bit. Otherwise aoe and ctx have been the standouts, like much of the energy sector.
3.28 Sold out of org for 1463 versus entry level of 1455 as it's all happening a bit slowly for me and I'm unconvinced about this trade. Sold a tiny amount of ctx at 1000 for luck and to cover costs. Tah has been on my watchlist to buy for over a week and is getting close. It may be a buy tomorrow. Newscorp, nws, was a buy yesterday. I hesitated and it's up again today. However, the 30 minute chart is making a bullish consolidation pattern. I could buy some with a good chance of the stock rallying on the open tomorrow. It would then be a question of assessing the scale of the move. I can't decide whether the intraday chart is showing a typical 4th wave consolidation before a fairly minor new high or whether there is a larger scale jump about to occur. Either way, I think a small position is justified. Here's the 30 minute chart.
The more I look at this, the more I think it's a reasonable short term trade but not the sort of thing I'm really looking to do. The weekly chart below shows that it was a simple reversal low with a break of the high of that engulfing bar being 1042. It's now 1133, so on further consideration I'll let this one pass.
4.00 I just ran through the top 50 to see if there was anything interesting shaping up into the end of the day. There are a few possibilities but nothing requiring action now. Of my existing positions, tls is the one of most immediate concern. I'm in this as a reversal trade on the weekly but the intraday chart has made a potential lower high while the daily chart has formed an inside day. I'm still bullish but I'm concerned that the stock could slip back towards 300 before resuming a rally. Here's the daily chart.

I'm thinking of stopping out at 310 if there's weakness tomorrow.

4.10 Sold a few mgr at 86.5 (entry 85.5) and tls at 313 (vs 310) as they've both disappointed slightly on the day. Ilu closed near its lows at 425 and gpt drifted a bit to close at 35.5. Otherwise the rest were reasonably firm. Lnc finished at my entry level of 187.5 and although the entry signal was from a 30 minute chart, I decided to stay long overnight as support in the short term is at 184.

Tuesday, March 24, 2009

A little bit left. Tue Mar 24

Following on from the massive overnight rally in the US which was largely pre-empted in our time zone yesterday, we are continuing to rally with the XJO index up 1.5% at noon, slipping back from a high of 2.7% early on. The large cap stocks have again led the way with the only weak spots being the former safe havens such as csl, coh, wow and also the golds. Speaking of gold, I'm glad I sold out of my lgl position yesterday although I'm still in ncm. Ncm has recovered from sharp falls earlier but as it overlapped what I thought would be support levels, I'm planning to sell it out once the rally loses steam.
My other underperformers are org and tls. At the moment the pullbacks in these two are minor and there are no signs of lower highs forming on the 30 minute charts as yet. So I don't see any reason to stop out of either but I can imagine them falling a bit further because it's shaping up as one of those days where the market might sell off slowly all day. On March 18 and 19 the spi gapped open and sold off all day. Given the much larger gap it's more than possible that it could happen again. Of my existing positions, ctx is the most satisfying as it's really starting to take off today and I'm pretty confident that it will get to the February high of 1050 quite soon.

I ran through the top 100 stocks this morning and found quite a few potential trades, too many in fact. I'm considering cutting back to looking only at the top 50 as a way to ration the positions I put on, although I've often got a few favourites which I'll make exceptions for. The most interesting theme was property. As the latest US initiative encourages traders to speculate that credit might ease, the Australian property sector, which was overgeared and heavily sold ahead of expected equity issues, is looking quite interesting.

I've put on 3 positions in the sector this morning. One is a straightforward buy signal while the others are more questionable but the upside potential makes them worthwhile for me. The first is in cfx, a retail property trust.

The daily shows the stock breaking out this morning, and I bought some at 166.5 and more at 168.5 to average 167.5.

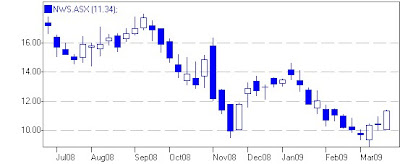
The other two positions are in gpt and mgr, 2 former powerhouses of the sector that overextended themselves in the boom. The charts are almost identical (as is gmg, another one in the sector) so I'll just show Mirvac Group, mgr.

I'm working on the assumption that the tightening consolidation between late October and mid January was a 4th wave correction which then failed as the stock fell to a 5th wave low a couple of bars ago. If that's the case and the stock is now correcting with a reversal low at 60 you might expect a rally to around 120, near the middle of the 4th wave consolidation. A confirmation would be if the stock pushed through 99.

The daily chart shows a nice run up from the lows with a roughly 61.8% fibonacci retracement and then strength today. It's a bullish continuation pattern setting up so I've taken it, for a few days at least, hoping that it can convert into a weekly position. I bought mgr at 85.5 and it's trading slightly above that at 86. I chased gpt early and paid too much, 39.5, as it's now 38. As I wrote earlier, its chart is very similar to that of mgr. The recent difference is that yesterday formed a white candlestick and I was desperate to buy towards the end of the day. I decided that if I was going to pre-empt a weekly move I should at least have some daily confirmation so I thought I'd wait till I saw a break above yesterday's high. The stock gapped open and I fell into the traders' trap of worrying about missing out. Don't! There's always another trade.

1pm Just sold ncm at 3312, which was still a profit having bought on the 19th at 3255 and sold some the following day at 3396. I suspect that this could be a stock I'll be shorting next week along with lgl. I also sold out of my penny dreadful, fms, at 6.7 versus an entry price of 6.3. No problems with the chart but it's a small position and I don't want to become overwhelmed with too many trades.
Having said that.....I then put on a position in another one, Carnegie Corporation, cnm. I saw the breakout at 18 last week but it was on news and sold off quickly from a brief high of 20. Presumably, a fair number of holders were waiting to sell into the news but a couple more days have passed and the stock is still looking firm so I jumped in at 19.


My excuse is that they're involved in wave power and I'm a fan of alternative energy technologies. The chart set up is quite promising. The dramatic change of scale between the first rally in December and the rally from February on, implies that the move from 12 to 21 was the first part of a larger scale move that should see 30+ faily soon. My only concern is if the correction has further to go.

2.58 Since my first post around noon today, the spi continued to slip away but only slowly and it's very stable now at 3602, hinting at a rally. Org and tls have been weak as feared and even made lower highs but as they don't seem close to complete I've stayed long and they're recovering somewhat.
I'm about to run through my stocks again. Of the positions I could have taken but didn't, I like Aristocrat, all, and Iluka, ilu. Iluka actually made a signal yesterday which I failed to spot and has continued today but with a pullback which may give me an entry.

3.47 After prevaricating all day I've bought some ilu at 449 as unlike a couple of my other trades today it has actually made the set up I'm looking for. Here's the weekly chart.

The daily chart shows the breakout through 440 yesterday. Iluka hit 456 earlier today so I'm not unhappy with getting in on a pullback at 449.

As ilu is the only one out of the possibles that has a clear signal I've left it at that.

4.10 The spi didn't manage to rally much at 3pm and kept slipping to 3582. After 4, and now after the match, it's rallying. Not in time to save me from some slightly negative markings. I put on 5 new positions today and 4 of them have closed a little against me. From the start of the day, I stopped out of ncm and sold out of fms. Tls is down 1, org down 12, aoe up 5 and ctx up 19.

Monday, March 23, 2009

Ring the bell for Telstra? Mon Mar 23

Two hours into the trading day the Aussie market is up 1.3% in a broad based rally. Even the weaker stocks are not showing signs of heading back towards their lows, they're mostly just pulling back after vertical rallies. Of the top 100, the only ones I could find that might give me a sell signal soon were ipl and mts.
On the positive side, there are quite a few stocks continuing to run or resuming after consolidation. I've added to my longs with a position in tls. I've taken a simple reversal signal with a break of last week's highs after a heavy 4 week slide. It's not a set up I'd always take - I generally like to see a higher low - but the market is bullish and similar recent set ups in mqg and nab have led to very sharp rallies. Here's the weekly chart.


The daily chart is supportive with a similar and stronger sort of bullish reversal. A black candlestick to new lows followed by a strong bounce back on Friday and a further rally breaking Friday's highs today. Going through my existing positions:

aoe - up 10 to 258 after pulling back on Thursday and Friday.

bsl - I'm sceptical really but after opening sharply lower this morning, bsl has fought back to be close to even. I see less upside for this than for my other stocks so I'm probably a bit closer to cutting this.

ctx - after chopping around at the end of last week this is now starting to look very good again.

fms - my speccy resource punt is a bit firmer and is charting well.

lgl - this has rallied well off a weak opening and has pushed up to 3 week highs but is starting to look temporarily complete on an intraday scale. I'm keeping a trailing stop fairly close.

ncm - slightly down on the day, looks like it should push above Friday's high in the next day or so.

Link energy, lnc, has consolidated after a sharp reversal and although it hasn't had a clean swing down on the weekly chart it has had a very tight consolidation and having fallen from 537 in late September to just under 100 a few weeks ago there is a fair bit of room to move.

The daily charts shows a bullish correction where the second leg down which completed on Friday did not go below the first leg down the week before.

After gapping up this morning on good news about the potential sale of some coal mining interests the stock has ranged tightly around 190. I'd buy some on signs of strength.

1.34 Stopped out of bsl at 247 as shorter term charts imply the stock might fall a bit from here and I'm a bit concerned that on the weekly scale there could be new lows to come soon. Entry was at 244.5 so a slight profit including the sale of some on Friday at 256.

3.11 Stopped out of lgl at 340 as it looks ready for consolidation. This was also a position where I was chasing a break and had some concerns about the potential for a lower high. Entry was 326. I've just bought some org at 1456 as the stock starts to resume a rally after a two week consolidation. The weekly chart had a slight swing down providing a buy level but it's easier to see on the daily chart.


I'm a little unsure of where I think the stock can rally to, but I suspect that the previous consolidation level around 1550 to 1600 would be a reasonable guess.

4.10 A very strong day with the index up well over 2% as the market focussed on overnight optimism in the US reflected in their futures. The top 20 was particularly strong with tls being a beneficiary, finishing up 4% at 315. Ncm was down on the day as gold stocks paused. I sold out of lgl and bsl and switched into org and tls. Neither of the stocks I sold needed to be cut but they were both consolidating, I had some misgivings about both, and I felt more confident moving into stocks which appeared to be in breakout mode.

Friday, March 20, 2009

Juggling. Fri Mar 20

Having bid up financials madly over the last week or so investors' focus has now moved to inflationary hedges as gold, oil and base metals rally and the US dollar continues to fall. So far today, at 11.15am, the result has been a stalemate with the market down a few points as materials rally and financials fall.

My positions are going reasonably well with the 2 gold stocks firm as well as bsl and ctx. Aoe, an energy stock, is surprisingly weak while fgl is flirting with 517, the low it reached earlier in the week. My stop is at 510 as I think that primarily it's range trading but I'm not too excited about the trade's prospects.
Unless fgl and aoe weaken sharply today, I won't be stopping out of anything. The next question is whether I should take any profits in the other positions but at this stage none of them are showing signs of topping out on an intraday level, such as confirming or suggesting lower highs. If they were to, I'd consider selling a portion out. The other cases where I could sell out of part of a trade might be if there was a wild move in my direction or if the stock hit a target.
I was thinking that 3400 would be a conservative target for ncm and it's trading at 3407 having been as high as 3434 but the daily chart, below, implies higher levels.

I've been running through the stocks in the top 100 index and can't see an opportunity to go short. Bhp, if it were to turn around next week, could suggest a lower high but that seems unlikely given the inflation hedge idea gaining ground.

There are two stocks that have cropped up over the last couple of days as potential buys. The first is Tabcorp, tah. The chart shows a stock that has lost all momentum on the downside. It made a marginal new low (by 1 cent) of 605 in late Feb and is shaping up to pivot through last week's high of 644. It's clearly in a trading range so not super exciting, but the top of the range is near 700 and it might make a straightforward low risk trade.

The daily chart shows that while tah is in a tight range there is a series of higher lows and a fairly flat top. There have been quite a few strong white candlesticks lately followed by mildly drifting pullbacks. For a stock that has low volatility there could be a sharp little move up.


Orica, ori, has also piqued my interest. It pivoted through 1354 last week and confirmed a higher low earlier this week when it ran up through 1430 to 1472.

I'm not keen to chase the market where I've missed the entry point but a look at the daily shows that ori is behaving bullishly with sharp moves up and slow corrections. I'm hoping that the current pullback might take the stock down towards 1300 giving me the opportunity to buy on a bullish daily set up. It might show up on the weekly anyway if it's slow enough.

12.28 Decided to stop out of fgl at 516 rather than use a wider stop at 510. Another look at the weekly makes me think that if fgl falls through 510 it might fall quite sharply so I'd rather just get out now. I've also sold out of a small amount of ncm at 3396 and bsl at 256. Ncm because it was stalling at 3400 and bsl because I'm not completely convinced it's hit a short term low so I want to sell small amounts into the rally.

3.28 I've been having a trawl through the penny dreadfuls and there are a few promising charts. I try to filter for volume so as to avoid wasting time and also to find stocks that others are using as trading vehicles. This is Flinders Mines, fms, a small iron explorer. After a big run in January there seems to have been a shallow correction with a resumption of strength this week as the stock broke through 6 cents.


I like fms, which I've bought at 6.3, because the daily has made a second recent buy signal after initially pulling back below the 6 cents level.


4.07 Approaching the end of day matchout my positions in aoe, bsl, and ctx have drifted off a little through the afternoon as the index sits towards the low of a day with a narrow trading range. It looks like lgl and ncm, the best movers on the day, will finish reasonably strongly. I'm off to yoga so that it's for the week.