I'm pretty confident that the market has made a top but we're having a decent retracement rally mimicking strength in US indices overnight. Here's a daily chart for S&P 500 index....

...and one for the Xjo.

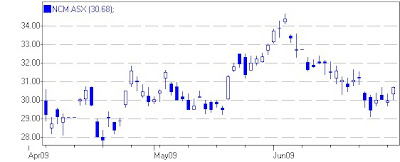
Gold has put together a few consecutive up days after bouncing off support. I've bought both Lihir Gold and Newcrest using 60 minute charts for guidance.
I hesitated with Lgl and paid 296. The buying opportunity was at 293 but the stock opened at 294. I waited to see if there was any real strength and then bought.  Ncm was a cleaner signal so I bought soon after the open at 3051.
These two gold stocks have similar daily charts to Awc where it's a simple reversal after steep falls. I normally prefer to have a pivot as in the 60 minute Ncm chart above but I'm willing to take these trades as the reversal is not the worst signal when allied with a good one in a 60 minute time frame.
Awc is up at 148 and I sold a third out on the open at that price (v 137.5). Cfx has fared less well toying with a trailing stop at 162.5 but just holding on; it's finding support now. Ozl is also weak but I think it might be forming a higher low so I could get the opportunity in a day or so to buy stock and leverage my existing position. Today's action looks poor but there isn't much volume, the sector is looking good, I don't think there's any stock specific news out and base metals have been recovering nicely over the last couple of days. The downside is that there's some medium term scepticism about the copper price and the company is now the operator of just one mine that's still in ramp up mode so increased risk associated with the stock has lowered appetite for it. In my world I'm just looking for the stock to find support and maybe pop up to 100 so these concerns are not completely relevant.
12.27 Out of Lgl for square at 296 as it's stalling and it's a short term momentum trade.
2.06 It's another day when I can't see a lot to do. I've sold another third of the Awc position at 150 with the rest sitting on the offer at 152. This is a judgement call but I'm not comfortable with being very long overnight after a couple of good retracement days, and this is more a momentum trade than anything.
3.39 The comment above shamed me into having a good look at the top 50 because in fact it has been a day of dramatic moves with some great bounces in Cba, Mqg, Nab and Qbe for example. All stocks I was short earlier in the week. Nevertheless, these moves haven't necessarily got a structure I like to work with. I did put on one trade in this style in Awc and that has been a big mover, up 9.4% but I was also tempted to go long Bhp and Rio and I'm glad I didn't as they're down today. Awc, at least, had a good set up on the 60 minute.
4.07 Approaching the match out I'm selling out the last of the Awc for 150 (? v 137.5). Cfx has been a disappointment, it's still above support but I'm reducing the position size with a sale at 164 (v 167). Ncm has eased off all day and I'm doing the same there at something like 3002 (v 3051). I don't want many positions right now - waiting/hoping for the resumption of the downtrend.
 Westfield hasn't quite made a buy signal but I noticed some steady buying so I bought early at 1114 and 1117. As I write this, it has just traded at 1120 so I've got my first indicator with confirmation of a break out quite a distance away at 1169. The reason I like this chart is that the retracement through most of June looked like a 4th wave down after a typical 3rd wave surge and it held above the 1st wave peak in mid May. The rally over the last week or so implies quite a bit of strength which could see the stock push easily past the June peak of 1235.


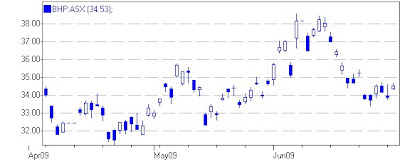
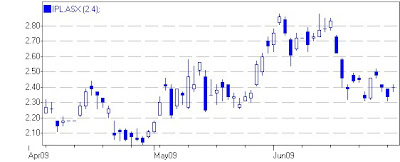
 What I like about Bhp and Ipl is that this is the third attempt to rally in the last 9 days showing that the selling pressure has eased dramatically. In the case of Rio the fall was extreme for a top 20 stock, probably accentuated by the pressure from the rights issue, so that although this is only the second attempt at a rally there's a bit of room to move. A 50% retracement of the fall would give a target just under 5500.