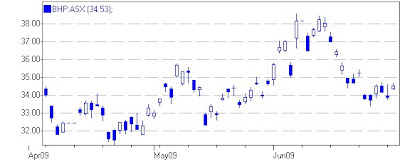
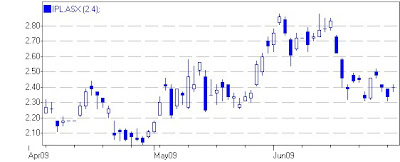
 What I like about Bhp and Ipl is that this is the third attempt to rally in the last 9 days showing that the selling pressure has eased dramatically. In the case of Rio the fall was extreme for a top 20 stock, probably accentuated by the pressure from the rights issue, so that although this is only the second attempt at a rally there's a bit of room to move. A 50% retracement of the fall would give a target just under 5500.
With all this buying I've got too much exposure and more positions than I want to deal with. Cfx has done well this morning, it's up 5 at 168.5, but because it's a relatively small position and not likely to be terribly explosive I'm getting out of it. Sold some at 167.5 (v 167) with a few to go. Of my other longs, Ozl is up 2 at 92 and is charting bullishly so I'm happy to continue running my August 90 calls. Tel, however, has drifted lower as it looks like one or more principal traders at the big brokers have been obliged to take on stock from a keen seller. I'm making that assumption on the basis of 4 crossings of 150 to 250 thousand stock at what looks like gradually declining levels. I had planned to sell my stock at 220 but wasn't aggressive enough to dump it early on.
2.22 The market has drifted sideways in a very tight range since soon after the open. I suppose everyone is waiting for the last half hour or so as things hot up on the last day of the financial year. It's like the middle overs of a one day cricket match with nobody taking any risks until the final slog.
2.43 Out of Cfx at 169 (v 167) while Tel is starting to firm up. Decent lines of stock are still changing hands but at 220 recently so the pressure is easing. I'm still trying to sell some at 220.
3.21 Things are starting to hot up with the Spi moving towards the top of the range. The same basic bullish set up is being repeated in a lot of the top 50 stocks eg Cwn, Map, Nws, Sgp, Sun, Wow. I've chosen the positions a little randomly, perhaps with the idea that the resource sector will move more explosively. I've also added another long position, which is stretching things, in Newcrest. I went early on this the other day and was chopped out but the signal is better now and confirmed the break trading above 3070 soon after I paid 3065. It is sitting around 3068 now. 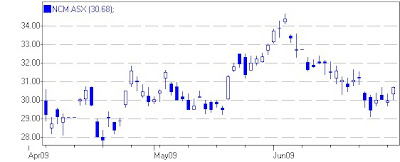
4.12 Interestingly, the wild action of previous quarter and year ends hasn't happened. It's possible that the warnings about ramping etc from the Stock Exchange have been heeded. I sold out a few Bhp at 3472 (v 3435), Bxb at 596 (v 592 av.) and half of my Tel for square at 218 in a modestly bullish match out.


 ...and one for the Xjo.
 Gold has put together a few consecutive up days after bouncing off support. I've bought both Lihir Gold and Newcrest using 60 minute charts for guidance.
 Ncm was a cleaner signal so I bought soon after the open at 3051.
 Today's action looks poor but there isn't much volume, the sector is looking good, I don't think there's any stock specific news out and base metals have been recovering nicely over the last couple of days. The downside is that there's some medium term scepticism about the copper price and the company is now the operator of just one mine that's still in ramp up mode so increased risk associated with the stock has lowered appetite for it. In my world I'm just looking for the stock to find support and maybe pop up to 100 so these concerns are not completely relevant.

 2.41 I've been faffing about now for over half an hour getting rid of Internet Explorer 8 which plays havoc with the blog software. IE8 automatically deleted IE7 making it difficult to go back despite the new layout being horrible. In the end I downloaded Firefox Mozilla in order to have a back up if it all failed meaning that Microsoft are doing great work in helping the competition. When I was a market maker paying tens of thousands a year for specialist software I had the same problem. Developers would make a raft of changes and then use the client as the guinea pig. It's the layout changes that are generally the worst as they seem so frivolous and random. It's as if you got up in the morning and the contents of your fridge are now in the laundry and your socks are in the cabinet with the DVDs...like having an energetic dementia patient come and do your cleaning.

 Unlike last week's action the move is broad based with a handful of defensives the modest outperformers.
 I've also gone short Orica and Qbe. Given my methodology, there are lots of signals this morning as stocks follow the same broad pattern as the Xjo. My approach is to try to pick the ones that suit me best. Therefore I'm not necessarily going for the stocks that have confirmed a sell signal as in the Ozl example above, but instead I'm looking for situations where the move is just beginning. With the change in tone of the market there's a higher than normal chance that they'll come good.
 With Orica, above, there's a strong chance it will test last week's low of 1946 and given the weakness we're seeing a quick move to 1800 could be on the cards. I'm short at 2022.
 12.22 My trade in Macquarie yesterday was a bit similar to Orica and initially it went against me. Fortunately I wasn't stopped out and today the stock has bounced off 3600 but is looking precarious. I punted some June 3500 puts at 18 which expire on Thursday because I think there's a good chance the stock fails to hold 3600 today in which case it could quickly blip down to 3500, 3550 giving me a nice day trade on the puts.
 1.33 The market is having its second attempt at a rally today but it isn't gaining traction. According to FNArena, a good local research site, Macquarie is the last of the major brokers to have downgraded the banks. It might have been the last straw because they're not outperforming for once and since they're such a large part of the index it will be hard for the market to bounce much if they're under pressure all day. We're down 3% now and normally I wouldn't expect much more but today could be different.

 12 pm The headline refers to sentiment. We've had a sustained rally from early March and I have been seeing signs of change in the charts. Relative laggards, ie defensives, are starting to look better again while resources began falling last week and banks look very tired but are still generally squeezing up. I've obviously been trying to force the trades in the banks but I do think they're close to a turning point. They're now more expensive than most brokers' valuations but the buying thesis is that the recession hasn't officially arrived and may not and that pricing power has increased with the demise of the smaller competitors. A respected veteran bank analyst has just put a sell on the sector on the basis that the recession will come, bad debts will increase and valuations leave little room to move. Those are the two forces at play and I'm obviously taking my cue from chart patterns but it's interesting that there is a catalyst for a sell off if optimism about the consumer falls.
 I've expanded the chart so it's easier to see; I went short on the 4th bar back as the stock made a new low - although still within a trading range - but it has now negated the signal trading above the previous high of 2239. Out at 62 (v 90).
 I've fallen into the trap of trying to force trades, especially in the financials. Still, I've copped most of the damage now so I can get on with putting on the right sort of trades now.
 This stock has had a long slow choppy rally typical of a retracement. The last couple of days weakness have made me think that we've got a potential lower high in place with the chance of a move down to around 40. I've bought July 53 puts at 7.5.
 3.50 The market has been up a bit, down a bit in the last hour or so. I've scanned through the stocks in the top 50 index and there are a lot more bearish than bullish charts. I'm nervous about going into Friday short with the market having been soft all week but although I can obviously see the chance of a rally tomorrow I can't see any standout reasons to cut my short positions. I've been broadly right this week but in the wrong sectors as the financials have been among the better performers in a falling market. Although I could see potential weakness in Bhp and Rio, for example, there was never an opportunity for me to get short at levels I was comfortable with. The nature of these stocks is that there are a lot of gaps because they're also listed and trade heavily in overseas markets, the same holds for Newscorp, and this reduces the efficiency of my trade entries.
 The next target would be the low under 570 in mid May as the stock had its first leg down.
 Also bought back the last of the small hedge in Wpl at 4093, not such a good buy as it's now 4072. The last of my June 4400 calls are only worth about 6 now compared to a buying price of 130. I did sell half out at 188 but hung on to the rest for way too long. The hedge, late as it was, managed to claw back 30 cents for each of the options remaining. There was ample opportunity to hedge at around 4300 and because the hedge would have been larger at that price level I could have retrieved most of the option value. This is a facet I need to improve on - I tend to mentally write off the value of the options and neglect my hedging. Once the stock has failed to do what I'm expecting there should be only two courses of action. Sell the option out or hedge. I can always reconsider once the picture is clearer. For example, in the case of Ozl this morning I felt the stock had hit support so I was happy to take off the hedge.
 Since the end of May there was only one day when Cba failed to make a higher low. I actually bought puts there only for the stock to resume its upward grind so you can see that this is by no means the best signal. Nevertheless, it has been a long run with fading momentum and the Mqg chart shows that once the stock cracks the momentum can reverse rapidly. I have some June 3700 puts bought at 88 on that earlier failed signal and now have a few more at 44.
  2.05 Mqg seems to be building on the support around 3600 so I sold out the June 3550 puts at 70 (v 100). Also bought a few more Cba June 3700 puts at 36 as the stock has had a bit of a rally within a down trend on the 60 minute chart.


 My view is that the high reached 3 bars back was a lower high, we get confirmation with a trade below 2161.


 2.39 I eventually paid 36 for Vba only for it to edge back, it's now at 35.


